How to Install Prometheus and Grafana on AWS EC2 + Domain, HTTPS, and Basic Auth
Author: Ferry Dermawan
Date:
Tags: aws, ec2, prometheus, grafana, monitoring, devops
If you are looking for a complete Prometheus and Grafana installation guide on AWS EC2, this tutorial walks you through the full setup from scratch to production-ready. This stack is ideal for Linux server monitoring because it is lightweight, flexible, and easy to extend for alerting.
In this article, you will set up:
- Prometheus to collect metrics
- Node Exporter for server metrics (CPU, RAM, disk, network)
- Grafana for monitoring dashboard visualization
- Domain + Nginx reverse proxy
- HTTPS with Let's Encrypt
- Basic Auth as an extra security layer
If your instance is not created yet, start with how to create an AWS EC2 instance. For web server hardening after the monitoring setup, continue with this secure Nginx SSL/TLS guide.
Table of contents
- Prerequisites for installing Prometheus and Grafana on EC2
- Monitoring architecture overview
- Install Prometheus
- Install Node Exporter
- Connect Prometheus to Node Exporter
- Enable auto-start with systemd
- Install and run Grafana
- Connect Grafana to Prometheus
- Import dashboard Node Exporter
- Set up Grafana domain with Nginx
- Set up HTTPS with Let's Encrypt
- Add Basic Auth
- Recommended Security Group rules for this monitoring stack
- Production best practices
- Quick troubleshooting
- FAQ
- Conclusion
Prerequisites for installing Prometheus and Grafana on EC2
Before you start, make sure:
- Your Ubuntu-based EC2 instance is running
- You have SSH access to the server
- A domain for Grafana is ready (optional, but recommended)
- Your Security Group allows ports
22,80, and443
Monitoring architecture overview
User → HTTPS → Nginx → Grafana → Prometheus → Node Exporter
1) Install Prometheus on EC2
cd /opt

wget https://github.com/prometheus/prometheus/releases/download/v3.11.2/prometheus-3.11.2.linux-amd64.tar.gz

tar -xvf prometheus-3.11.2.linux-amd64.tar.gz
mv prometheus-3.11.2.linux-amd64 prometheus
cd prometheus
Run:
./prometheus --config.file=prometheus.yml --web.listen-address="0.0.0.0:9090"
Access:
http://IP-EC2:9090
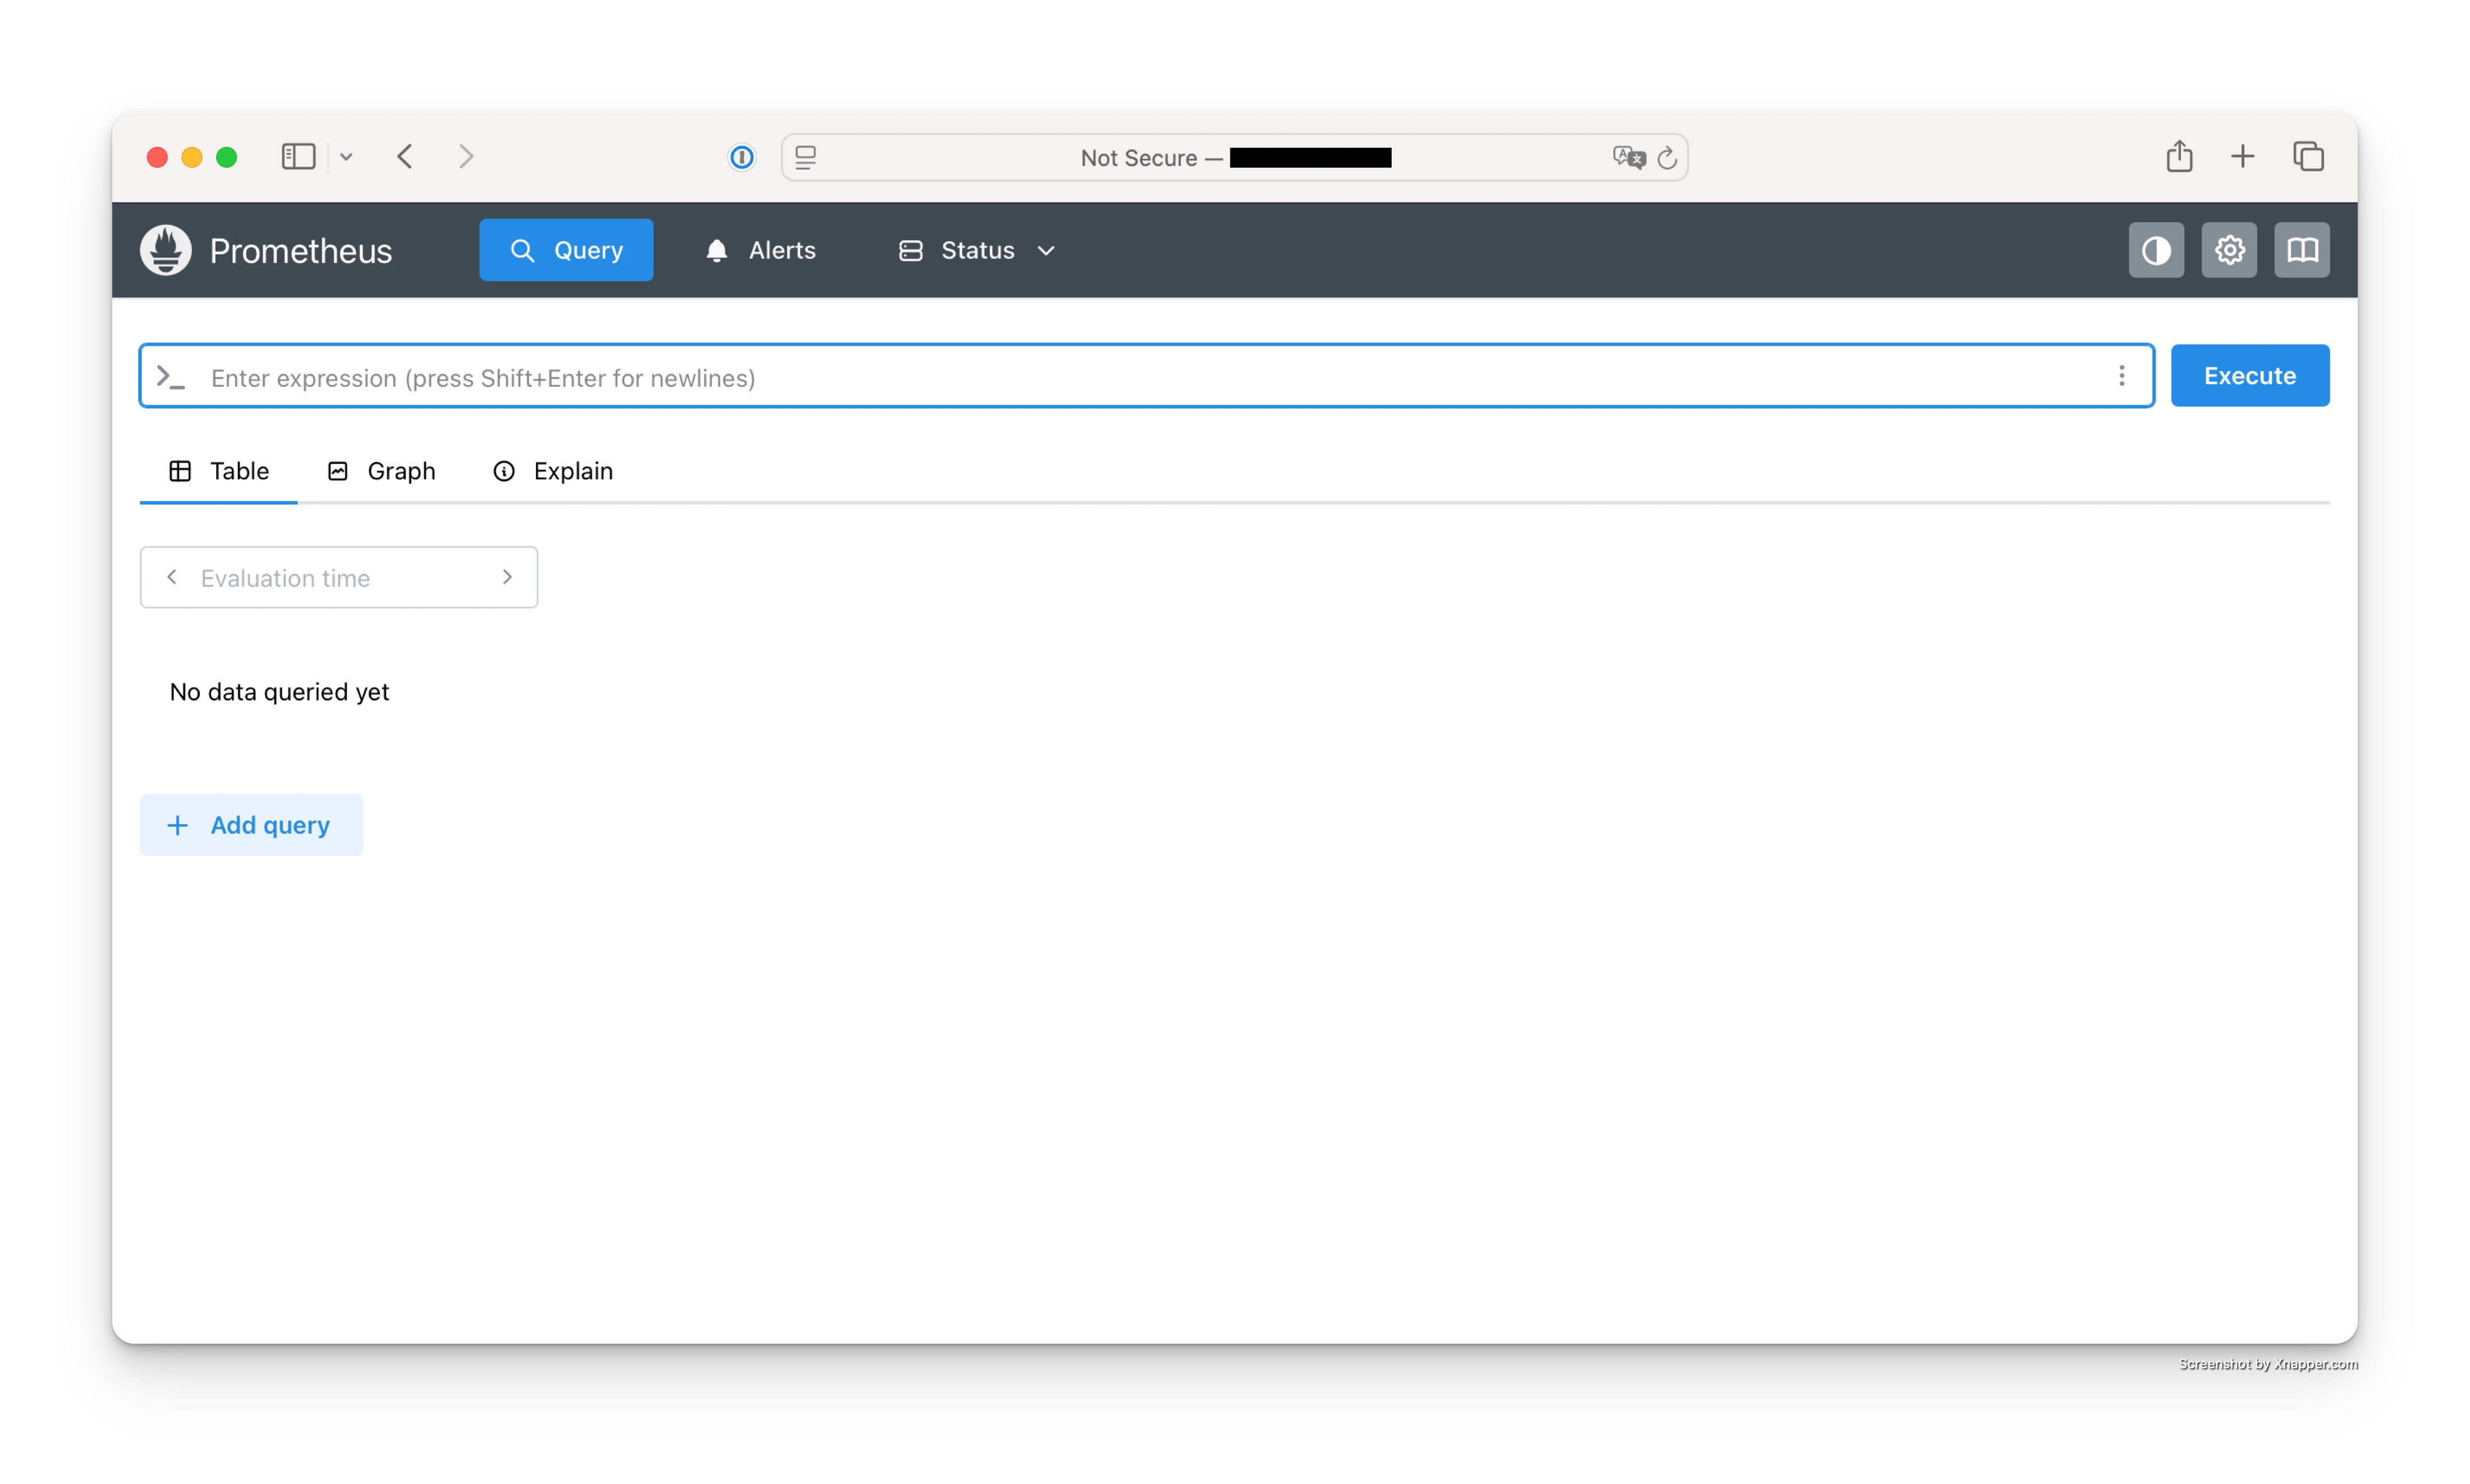 Screenshot of the Prometheus home page after the service starts successfully.
2) Install Node Exporter
cd /opt

wget https://github.com/prometheus/node_exporter/releases/download/v1.11.1/node_exporter-1.11.1.linux-amd64.tar.gz

tar -xvf node_exporter-1.11.1.linux-amd64.tar.gz
mv node_exporter-1.11.1.linux-amd64 node_exporter
cd node_exporter
Run:
./node_exporter --web.listen-address="0.0.0.0:9100"
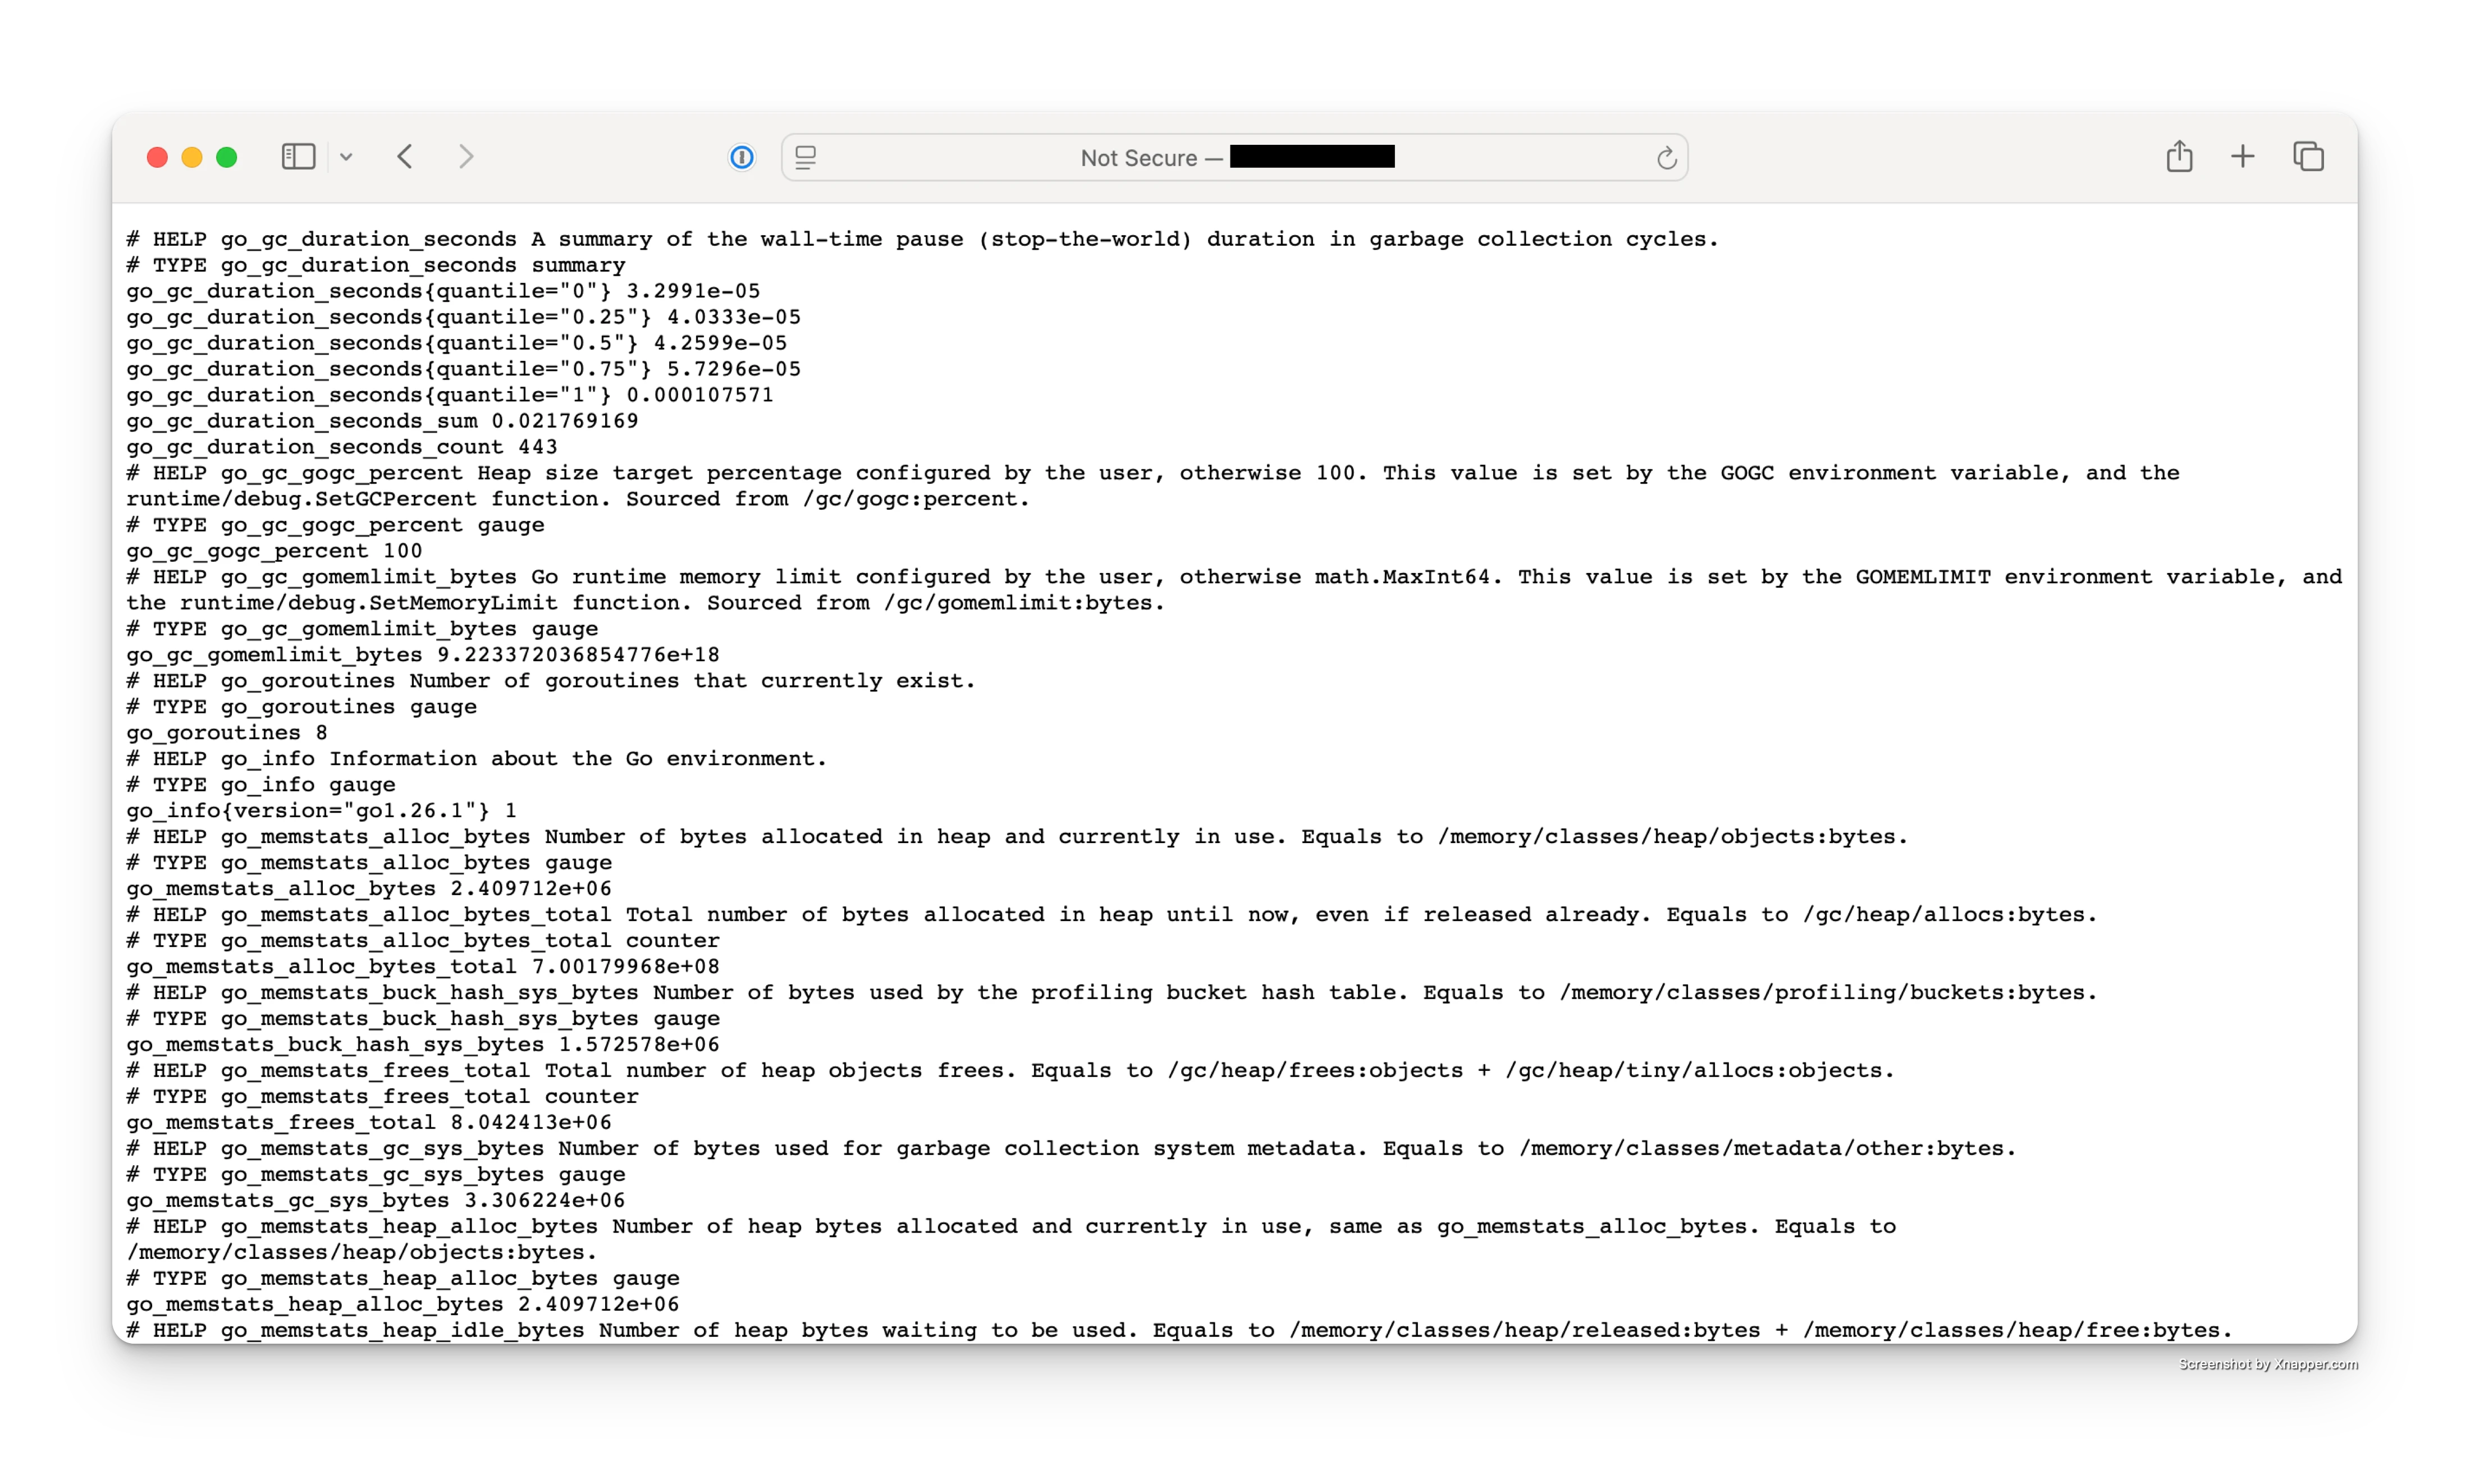 Screenshot of the Node Exporter metrics endpoint at
 http://IP-EC2:9100/metrics.
3) Connect Prometheus to Node Exporter
Edit config:
nano /opt/prometheus/prometheus.yml
Add:
scrape_configs:
  - job_name: 'node'
    static_configs:
      - targets: ['localhost:9100']
Restart Prometheus:
pkill prometheus
./prometheus --config.file=prometheus.yml --web.listen-address="0.0.0.0:9090"
4) Enable auto-start with systemd
Service Prometheus
nano /etc/systemd/system/prometheus.service
[Unit]
Description=Prometheus
After=network.target

[Service]
ExecStart=/opt/prometheus/prometheus --config.file=/opt/prometheus/prometheus.yml --web.listen-address=0.0.0.0:9090
Restart=always

[Install]
WantedBy=multi-user.target
Node Exporter Service
nano /etc/systemd/system/node_exporter.service
[Unit]
Description=Node Exporter
After=network.target

[Service]
ExecStart=/opt/node_exporter/node_exporter --web.listen-address=0.0.0.0:9100
Restart=always

[Install]
WantedBy=multi-user.target
Enable services:
systemctl daemon-reload
systemctl enable prometheus
systemctl start prometheus

systemctl enable node_exporter
systemctl start node_exporter
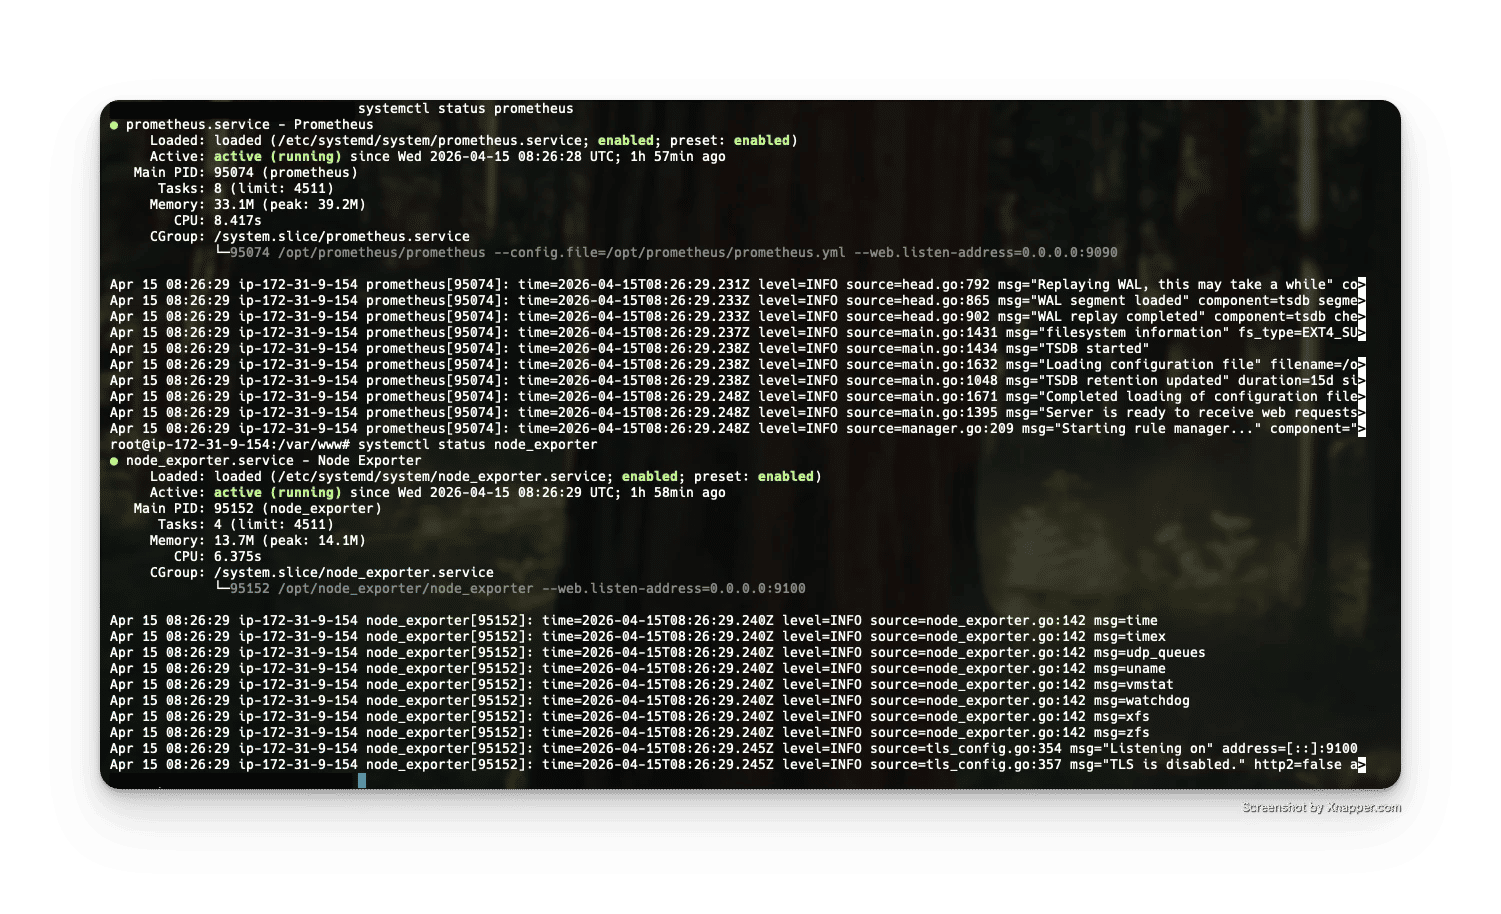 Screenshot of
 systemctl status prometheus and systemctl status node_exporter checks.
5) Install Grafana
apt-get install -y adduser libfontconfig1 musl

wget https://dl.grafana.com/grafana/release/13.0.0/grafana_13.0.0_24384745231_linux_amd64.deb

dpkg -i grafana_13.0.0_24384745231_linux_amd64.deb
apt-get install -f -y
Start:
systemctl start grafana-server
systemctl enable grafana-server
Access:
http://IP-EC2:3000
Login:
admin / admin
 Screenshot of the Grafana login page on port
 3000.
6) Connect Grafana to Prometheus
In Grafana:
- Settings → Data Sources
- Add → Prometheus
- URL:
http://localhost:9090
Click Save & Test
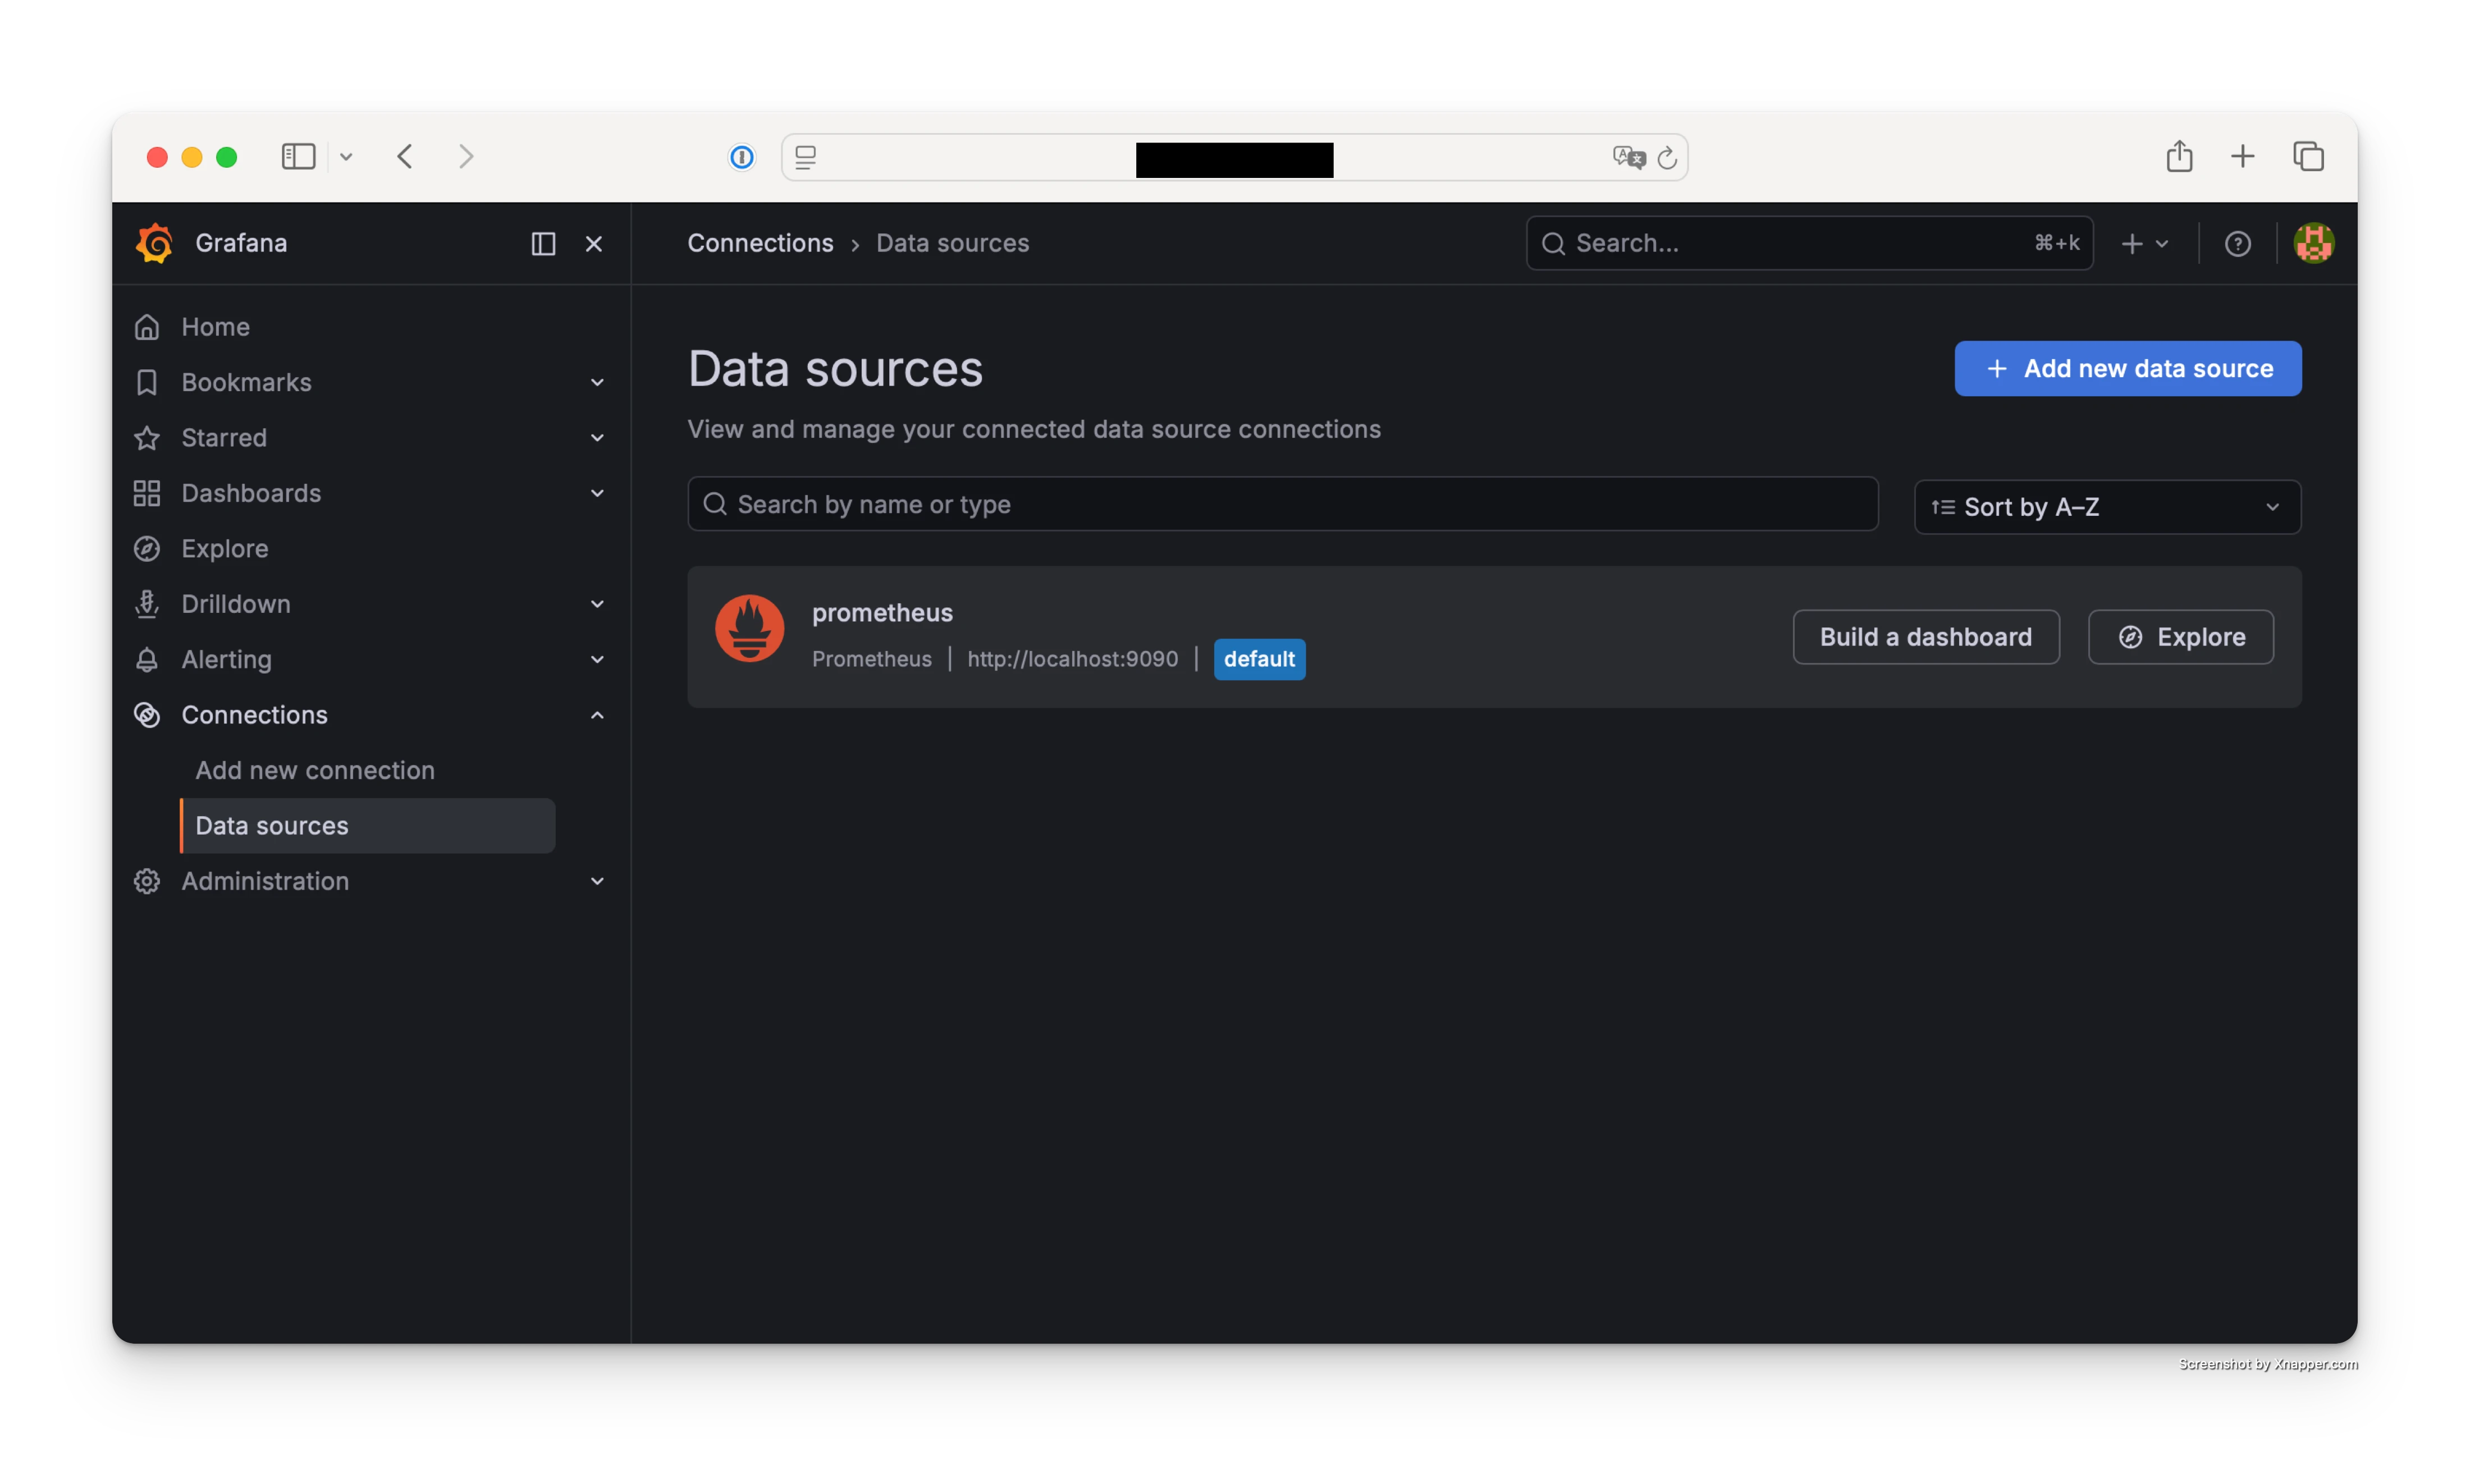 Screenshot of Grafana Prometheus Data Source settings (
http://localhost:9090) and Save & Test result.
7) Import dashboard Node Exporter
Use dashboard ID:
1860
👉 Node Exporter Full dashboard
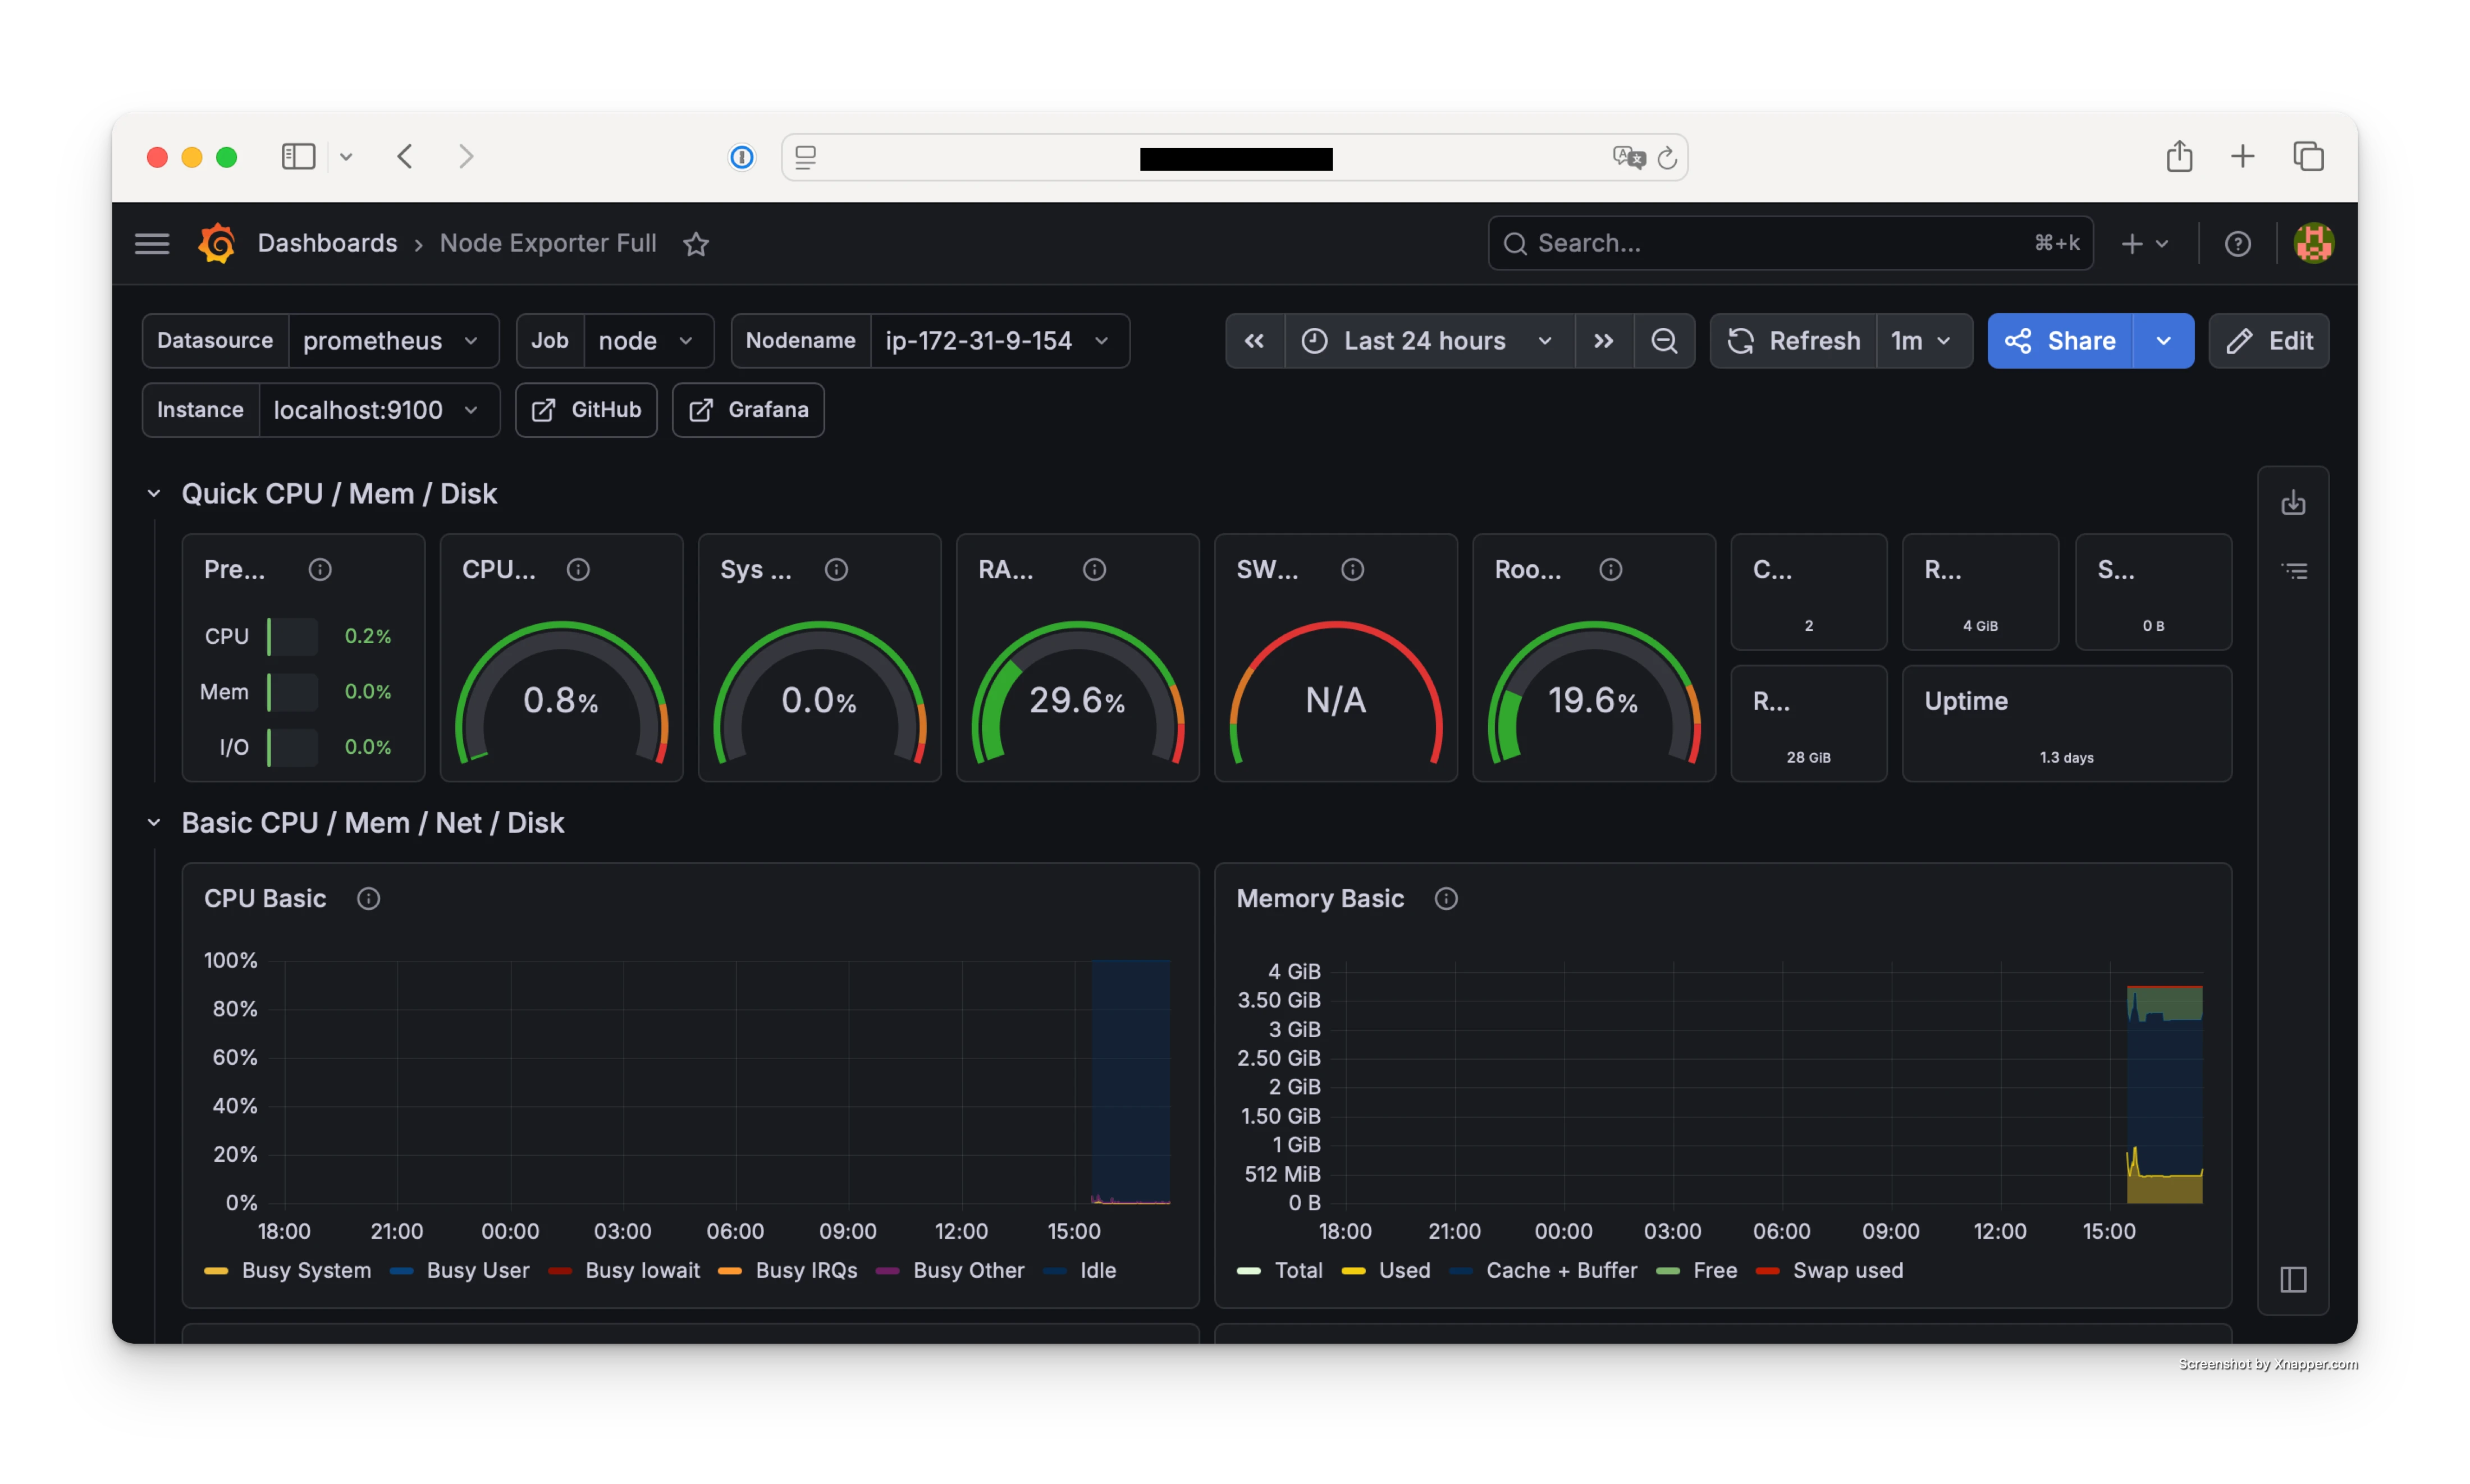 Screenshot of importing dashboard ID
 1860 and the final dashboard view.
8) Set up Grafana domain with Nginx
Example:
grafana.studiku.id → IP EC2
Install Nginx:
apt install nginx -y
Config:
server {
    listen 80;
    server_name grafana.studiku.id;

    location / {
        proxy_pass http://localhost:3000;
    }
}
9) Set up HTTPS with Let's Encrypt
Use Let's Encrypt:
apt install certbot python3-certbot-nginx -y
certbot --nginx -d grafana.studiku.id
10) Add Basic Auth
location / {
    proxy_pass http://localhost:3000;

    auth_basic "Restricted";
    auth_basic_user_file /etc/nginx/.htpasswd;
}
Create a user:
htpasswd -c /etc/nginx/.htpasswd admin
11) Recommended Security Group rules for this monitoring stack
| Port | Notes |
|---|---|
| 22 | SSH (your own IP only) |
| 80 | HTTP |
| 443 | HTTPS |
| 3000 | ❌ close |
| 9090 | ❌ close |
| 9100 | ❌ close |
Production best practices
- Use HTTPS
- Do not expose Prometheus and Node Exporter publicly
- Add Basic Auth
- Configure monitoring alerts
Quick troubleshooting
Grafana cannot connect to Prometheus
Make sure the Grafana data source URL is:
http://localhost:9090
Then verify the Prometheus service is running.
Dashboard is empty or metrics are missing
Check the localhost:9100 target on the Status > Targets page in Prometheus.
HTTPS certificate issuance fails
Make sure your domain DNS points to the EC2 public IP and ports 80/443 are open in the Security Group.
FAQ
Do Prometheus and Grafana need separate servers?
Not required. For low-to-medium traffic, one EC2 instance is usually enough. For higher load, separating components can improve stability.
Can ports 3000, 9090, and 9100 be publicly exposed?
It is not recommended for production. Access should go through the HTTPS domain behind Nginx only.
Is Basic Auth still needed if Grafana already has login?
Yes. It adds another protection layer before users even reach the Grafana login page.
Conclusion
With this setup, you get a secure and production-ready AWS EC2 monitoring stack:
- Real-time server monitoring
- Professional dashboards
- Secure access via domain and HTTPS
- A production-ready system
Next steps to optimize monitoring
For a more advanced production setup:
- Send alerts to Teams / Telegram
- Add Laravel monitoring (queue, DB)
- Set up log monitoring
If your deployment workflow is based on GitHub, you can combine this setup with a safer repository access pattern from secure git clone GitHub to EC2.